Category:Traffic Monitor
From Bondix Wiki
Traffic Monitor
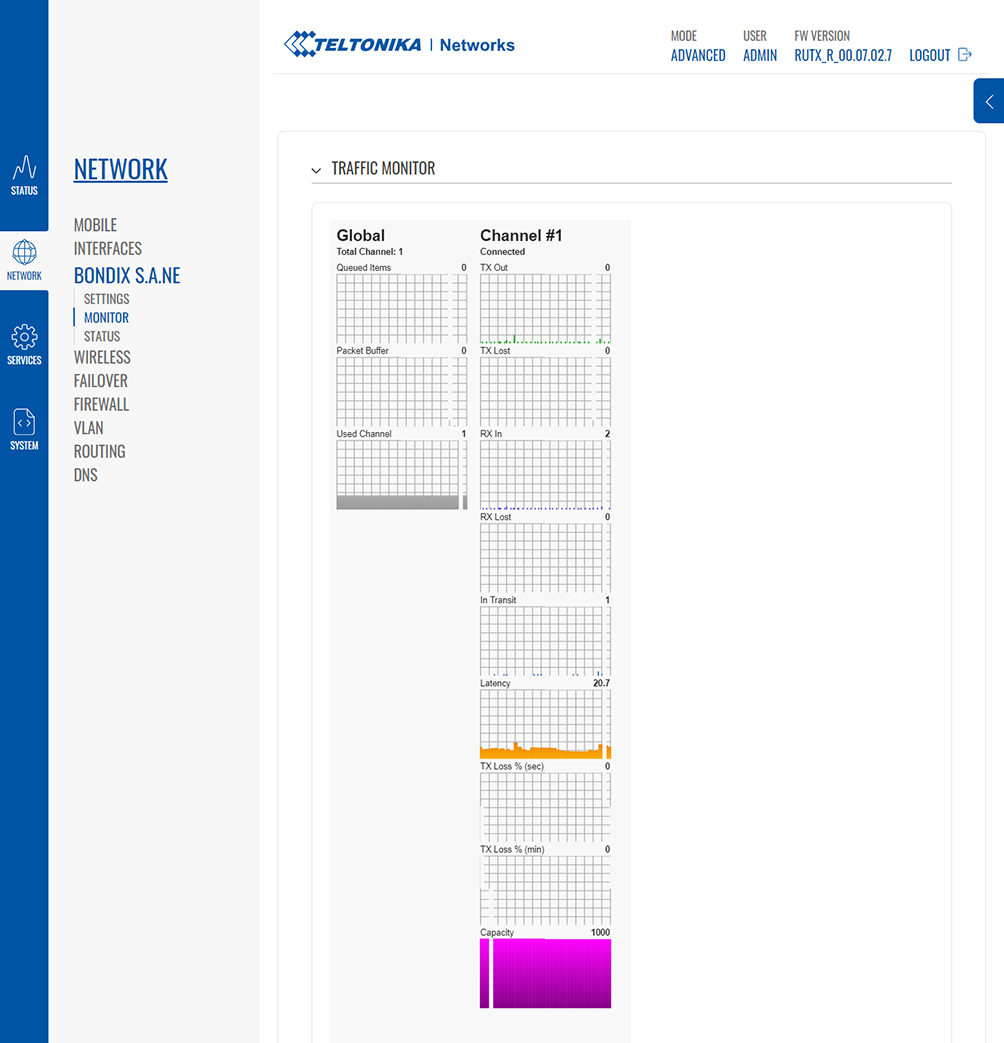
Clicking on the “Monitor” link in your Teltonika router’s Bondix S.A.NE menu will give you a graphical overview of the data traffic and the connection status of your tunnel’s connected WAN links:
Global
| Value | Description |
|---|---|
| Queued Items | Packets that have been received locally but haven’t been sent yet. |
| Packet Buffer | Total amount of packets in cache. |
| Used Channel | Number of active channels. |
Channel
| Value | Description |
|---|---|
| TX Out | Number of outgoing traffic packets. |
| TX Lost | Number of lost outgoing traffic packets. |
| RX In | Number of incoming traffic packets. |
| RX Lost | Number of lost incoming traffic packets. |
| In Transit | Packets that have been sent but not acknowledged yet. |
| Latency | Latency in ms. |
| TX Loss % (sec) | Measured outgoing packet loss over the last second. |
| TX Loss % (min) | Measured outgoing packet loss over the last minute. |
| Capacity | Number of packets that can be sent out through the channel. |
Pages in category "Traffic Monitor"
This category contains only the following page.
